Matplotlib: arrows
| Date: | 2007-12-06 (last modified), 2007-12-06 (created) |
|---|
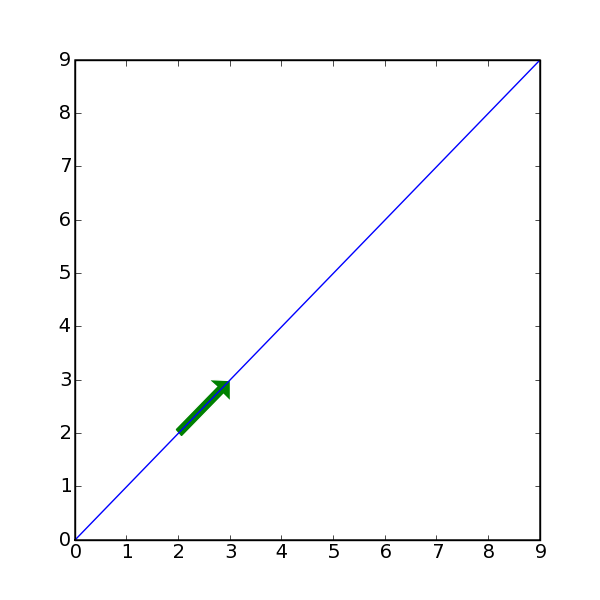
Some example code for how to plot an arrow using the Arrow function.
In [3]:
from matplotlib.pyplot import *
from numpy import *

x = arange(10)
y = x

# Plot junk and then a filled region
plot(x, y)

# Now lets make an arrow object
arr = Arrow(2, 2, 1, 1, edgecolor='white')

# Get the subplot that we are currently working on
ax = gca()

# Now add the arrow
ax.add_patch(arr)

# We should be able to make modifications to the arrow.
# Lets make it green.
arr.set_facecolor('g')

Section author: jesrl
Attachments