Matplotlib: hint on diagrams
| Date: | 2010-03-30 (last modified), 2009-05-14 (created) |
|---|
Hinton diagrams with matplotlib
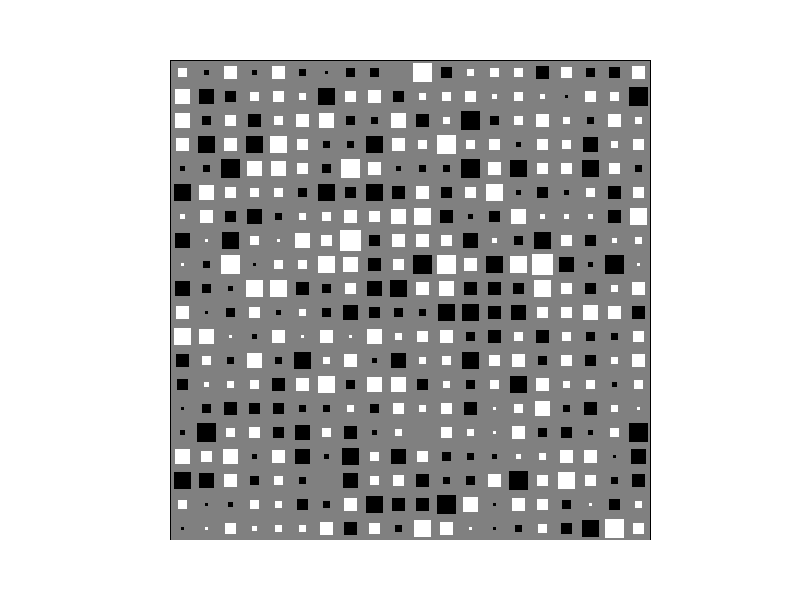
Hinton diagrams are a way of visualizing numerical values in a matrix/vector, popular in the neural networks and machine learning literature. The area occupied by a square is proportional to a value's magnitude, and the colour (black or white in this case) indicates its sign (positive/negative).
 )#
)#
In [ ]:
import numpy as N
import pylab as P

def _blob(x,y,area,colour):
    """
    Draws a square-shaped blob with the given area (< 1) at
    the given coordinates.
    """
    hs = N.sqrt(area) / 2
    xcorners = N.array([x - hs, x + hs, x + hs, x - hs])
    ycorners = N.array([y - hs, y - hs, y + hs, y + hs])
    P.fill(xcorners, ycorners, colour, edgecolor=colour)

def hinton(W, maxWeight=None):
    """
    Draws a Hinton diagram for visualizing a weight matrix.
    Temporarily disables matplotlib interactive mode if it is on,
    otherwise this takes forever.
    """
    reenable = False
    if P.isinteractive():
        P.ioff()
    P.clf()
    height, width = W.shape
    if not maxWeight:
        maxWeight = 2**N.ceil(N.log(N.max(N.abs(W)))/N.log(2))

    P.fill(N.array([0,width,width,0]),N.array([0,0,height,height]),'gray')
    P.axis('off')
    P.axis('equal')
    for x in xrange(width):
        for y in xrange(height):
            _x = x+1
            _y = y+1
            w = W[y,x]
            if w > 0:
                _blob(_x - 0.5, height - _y + 0.5, min(1,w/maxWeight),'white')
            elif w < 0:
                _blob(_x - 0.5, height - _y + 0.5, min(1,-w/maxWeight),'black')
    if reenable:
        P.ion()
    P.show()
Section author: Unknown[79], MartinSpacek
Attachments