Matplotlib: using tex
| Date: | 2008-12-04 (last modified), 2006-01-22 (created) |
|---|
Matplotlib can use LaTeX to handle the text layout in your figures. This option (which is still somewhat experimental) can be activated by setting text.usetex : true in your rc settings. Text handling with matplotlib's LaTeX support is slower than standard text handling, but is more flexible, and produces publication-quality plots. The results are striking, especially when you take care to use the same fonts in your figures as in the main document.
Matplotlib's LaTeX support is still under development, although at least two individuals have relied upon it to generate the figures for their doctoral dissertations. Many improvements have been made beginning with matplotlib-0.87, please update matplotlib if you have an earlier version. This option requires a working LaTeX installation, dvipng (which may be included with your TeX installation), and ghostscript (AFPL, GPL, or ESP ghostscript should all work, but GPL ghostscript-8.60 or later is recommended). The executables for these external dependencies must be located on your PATH.
There are a couple of options to mention, which can be changed using rc settings, either using a matplotlibrc file, or the rcParams dict in your program. Here is an example matplotlibrc file:
font.family        : serif
font.serif         : Times, Palatino, New Century Schoolbook, Bookman, Computer Modern Roman
font.sans-serif    : Helvetica, Avant Garde, Computer Modern Sans serif
font.cursive       : Zapf Chancery
font.monospace     : Courier, Computer Modern Typewriter

text.usetex        : true
The first valid font in each family is the one that will be loaded. If the fonts are not specified, the Computer Modern fonts are used by default. All of the other fonts are Adobe fonts. Times and Palatino each have their own accompanying math fonts, while the other Adobe serif fonts make use of the Computer Modern math fonts. See psnfss2e.pdf for more details.
To use tex and select e.g. Helvetica as the default font, without edititing matplotlibrc use:
#!python
from matplotlib import rc
rc('font',**{'family':'sans-serif','sans-serif':['Helvetica']})
## for Palatino and other serif fonts use:
#rc('font',**{'family':'serif','serif':['Palatino']})
rc('text', usetex=True)
N.B. You need to do this before you import `matplotlib.pylab`.
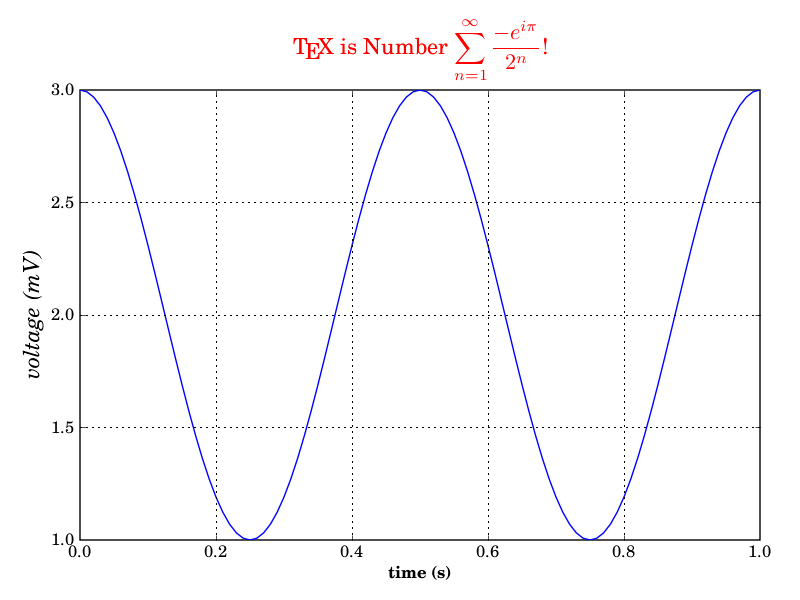
Here is the standard example, tex_demo.py:
from matplotlib import rc
from matplotlib.numerix import arange, cos, pi
from pylab import figure, axes, plot, xlabel, ylabel, title, grid, savefig, show

rc('text', usetex=True)
figure(1)
ax = axes([0.1, 0.1, 0.8, 0.7])
t = arange(0.0, 1.0+0.01, 0.01)
s = cos(2*2*pi*t)+2
plot(t, s)

xlabel(r'\textbf{time (s)}')
ylabel(r'\textit{voltage (mV)}',fontsize=16)
title(r"\TeX\ is Number $\displaystyle\sum_{n=1}^\infty\frac{-e^{i\pi}}{2^n}$!", fontsize=16, color='r')
grid(True)
savefig('tex_demo')

show()

Note that when TeX/LaTeX support is enabled, you can mix text and math modes. Display math mode (\$\$ e=mc^2 \$\$) is not supported, but adding the command \displaystyle, as in tex_demo.py, will produce the same results.
In order to produce encapsulated postscript files that can be embedded in a new LaTeX document, the default behavior of matplotlib is to distill the output, which removes some postscript operators used by LaTeX that are illegal in an eps file. This step produces fonts which may be unacceptable to some users. One workaround is to to set ps.distiller.res to a higher value (perhaps 6000) in your rc settings. A better workaround, which requires [http://www.foolabs.com/xpdf/download.html xpdf] or [http://poppler.freedesktop.org/ poppler] (the new backend to xpdf) can be activated by changing the rc ps.usedistiller setting to xpdf. The xpdf alternative produces postscript with text that can be edited in Adobe Illustrator, or searched for once converted to pdf.
Possible Hangups
On Windows, the PATH environment variable may need to be modified to find the latex, dvipng and ghostscript executables. This is done by going to the control panel, selecting the "system" icon, selecting the "advanced" tab, and clicking the "environment variables" button (and people think Linux is complicated. Sheesh.) Select the PATH variable, and add the appropriate directories.
Using MiKTeX with Computer Modern fonts, if you get odd -Agg and PNG results, go to MiKTeX/Options and update your format files
The fonts look terrible on screen. You are probably running Mac OS, and there is some funny business with dvipng on the mac. Set text.dvipnghack : True in your matplotlibrc file.
On Ubuntu and Gentoo, the base texlive install does not ship with the type1cm package. You may need to install some of the extra packages to get all the goodies that come bundled with other latex distributions.
Some progress has been made so Matplotlib uses the dvi files directly for text layout. This allows latex to be used for text layout with the pdf and svg backends, as well as the *Agg and PS backends. In the future, a latex installation may be the only external dependency.
In the event that things dont work
Try
rm -r ~/.matplotlib/*cacheMake sure LaTeX, dvipng and ghostscript are each working and on your PATH.
Run your script with verbose mode enabled: python example.py --verbose-helpful (or --verbose-debug-annoying) and inspect the output. Most likely there is a problem reported there. If you need help, post a short example that reproduces the behavior, explicitly noting any changes to your rc settings, along with what version of matplotlib you have installed, your os, and the --verbose-* output.
Section author: AndrewStraw, Unknown[117], Unknown[118], Unknown[119]
Attachments