Scripting Mayavi 2: filters
| Date: | 2007-08-12 (last modified), 2007-08-10 (created) |
|---|
Introduction
Well, until now, examples above are quite simple: scalars or vectors data are presented in the "vaccum", i.e. there is not object or material or whatsoever.
In others words, how can one display some object, say a metallic parallellepiped, for example, in a scalars or vectors field ?
The first filter you will be presented here deals with this problem.
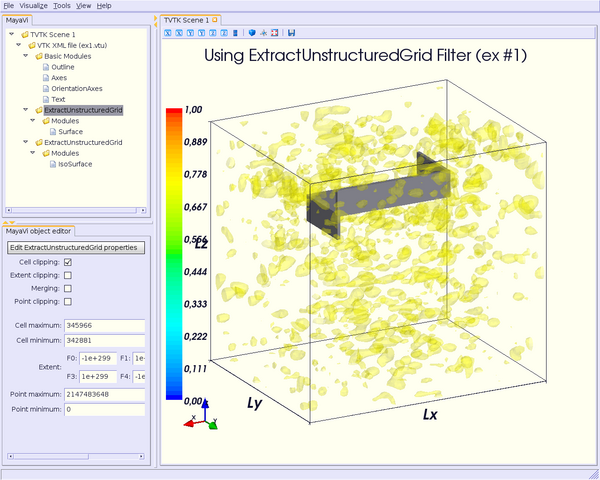
ExtractUnstructuredGrid filter
For this example, we suppose several hypotheses:
* the mesh of the volume data is made of 76x60x72 cubic cells (8 vertices); thus, the VTK object cell used for the "vaccum" is called VTK_HEXAHEDRON (#12). Cell ids begins at 0 and ends at #342880.
* a metallic parallellepiped is immersed in a EM field spreading over the whole volume data ; this object is made of faceted cells (4 vertices), called VTK_QUAD (#9) cells in VTK denomination. These faceted cells are used here because of the null EM field within the parallellepiped. Cell ids begin at #342881 and end at #345966.
* as there are different kinds of cells, the !UnstructuredGrid data set must be used (seehttp://www.vtk.org/pdf/file-formats.pdfto know how !UnstructuredGrid files must be written, VTK cells syntax, etc).
To display the metallic parallellepiped as a separate object from the vaccum, you have to extract the cells corresponding to this object. Thus, you will be able to display this object using the Surface module for example.
First, import !ExtractUnstructuredGrid filter and Surface module, as usual:
from enthought.mayavi.modules.surface import Surface

from enthought.mayavi.filters.extract_unstructured_grid import ExtractUnstructuredGrid
then
### for the metallic parallellepiped
script.engine.current_object = src  # current object must be set to the source
eug1 = ExtractUnstructuredGrid()
script.add_filter(eug1)
eug1.filter.cell_clipping = True
eug1.filter.cell_minimum = 342881
eug1.filter.cell_maximum = 345966
s = Surface()                       # the metallic is displayed using Surface module
eug1.add_module(s)                  # the module must be added to the current filter
s.actor.mapper.scalar_visibility = False
s.actor.property.color = (0.509804, 0.5098040, 0.5490196) # grey color for the metallic parallellepiped

### we need also extract the required cells for and only for the vaccum
script.engine.current_object = src  # current object must be set to the source
eug2 = ExtractUnstructuredGrid()
script.add_filter(eug2)
eug2.filter.cell_clipping = True
eug2.filter.cell_minimum = 0
eug2.filter.cell_maximum = 342880

### here, we can display the EM field using ScalarCutPlane/VectorCutPlane,
### Surface, Vectors modules as usual
.../...
This should look like this:
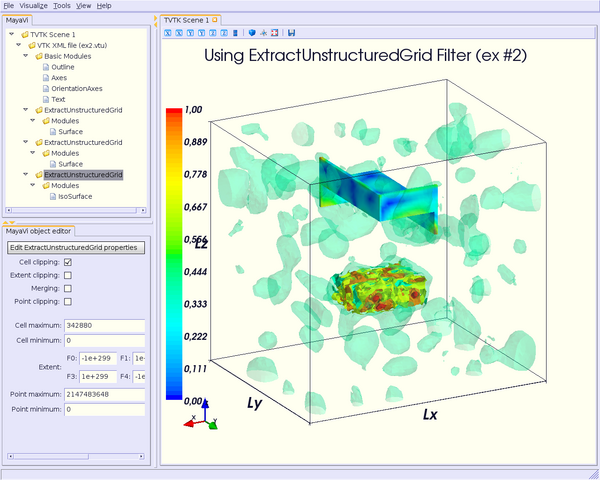
. Thus we have to use some 3D cells, as VTK_HEXAHEDRON cells (cell ids go from #345967 to #349094). We also want to display the field on the surface on the metallic object and in the dielectric object.
### for the metallic parallellepiped
script.engine.current_object = src
eug1 = ExtractUnstructuredGrid()
script.add_filter(eug1)
eug1.filter.cell_clipping = True
eug1.filter.cell_minimum = 342881
eug1.filter.cell_maximum = 345966
s = Surface()
eug1.add_module(s)
s.actor.mapper.scalar_visibility = True # scalar field on the surface

### for the dielectric parallellepiped
script.engine.current_object = src
eug2 = ExtractUnstructuredGrid()
script.add_filter(eug2)
eug2.filter.cell_clipping = True
eug2.filter.cell_minimum = 345967
eug2.filter.cell_maximum = 349094
s = Surface()
eug2.add_module(s)
s.actor.mapper.scalar_visibility = True # scalar field set to on
s.enable_contours = True                # in the volume

### we need also extract the required cells for and only for the vaccum
script.engine.current_object = src  # current object must be set to the source
eug3 = ExtractUnstructuredGrid()
script.add_filter(eug3)
eug3.filter.cell_clipping = True
eug3.filter.cell_minimum = 0
eug3.filter.cell_maximum = 342880

.../...
This should render this:
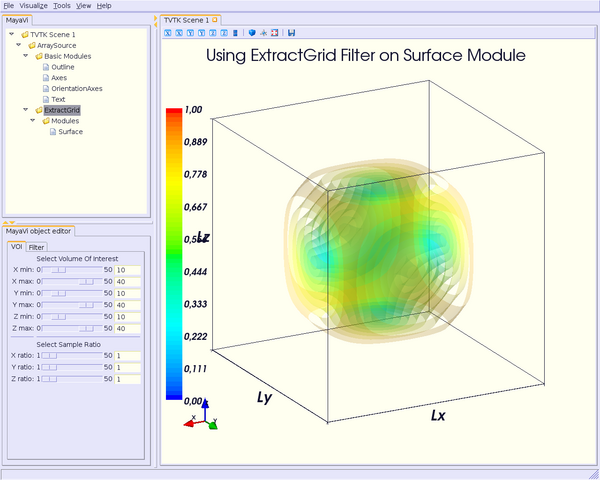
 on structured grids: you only have to set min/max values for x, y, z coordinates. Thus, you can cut a subvolume of your data. You can also apply a ratio on each coordinates, to decrease the cells number.
Import, as usual, the required modules and/or filter:
from enthought.mayavi.modules.surface import Surface

from enthought.mayavi.filters.extract_grid import ExtractGrid
then you can set filter's limits as:
eg = ExtractGrid()
script.add_filter(eg)
eg.x_min, eg.x_max = 10, 40
eg.y_min, eg.y_max = 10, 40
eg.z_min, eg.z_max = 10, 40
# eg.x_ratio = 2
# eg.y_ratio = 2
# eg.z_ratio = 2
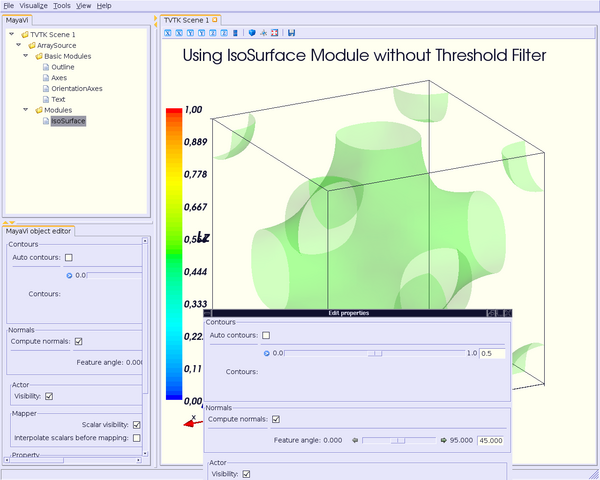
# same example using Surface module
s = Surface()
s.enable_contours = True
s.contour.auto_contours = True
s.contour.number_of_contours = 10
s.actor.property.opacity = 0.2
script.add_module(s)
s.contour.minimum_contour = 0
s.contour.maximum_contour = 1
s.module_manager.scalar_lut_manager.data_range = [0, 1]

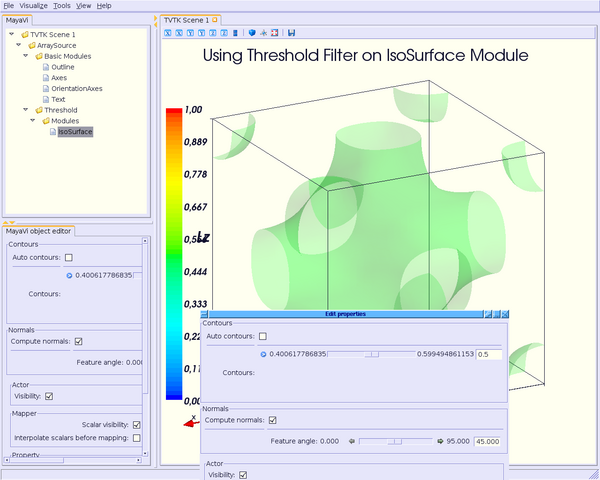
script.add_filter(thh)
thh.lower_threshold = 0.4
thh.upper_threshold = 0.6
isosurf = IsoSurface()
thh.add_module(isosurf)
isosurf.contour.contours = [0.5]
isosurf.compute_normals = True
isosurf.actor.property.opacity = 0.2
isosurf.module_manager.scalar_lut_manager.data_range = [0, 1]
and you're done !
This should look like this:
.
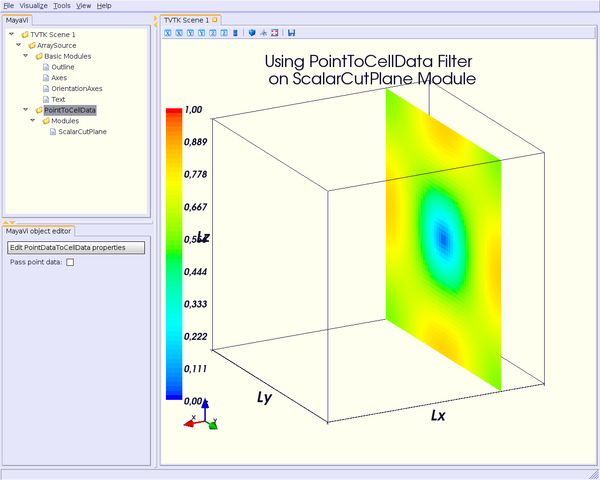
PointToCellData filter
Generally, data are interpolated between each point. Thus, they look like nicer.
But maybe in some case, you don't want them to be interpolated, and see the data "as they are": they are not displayed as points, but as cells. In this case, you can use the !PointToCellData filter.
Let's see again the example using the !ScalarCutPlane module, and import the !PointToCellData filter:
from enthought.mayavi.modules.scalar_cut_plane import ScalarCutPlane

from enthought.mayavi.filters.point_to_cell_data import PointToCellData
then add the !ScalarCutPlane module "above" the !PointToCellData filter, as usual:
ptocd = PointToCellData()
script.add_filter(ptocd)
scp = ScalarCutPlane()
ptocd.add_module(scp)
scp.implicit_plane.normal = (1, 0, 0)
scp.implicit_plane.origin = (10, 25, 25)
scp.implicit_plane.widget.enabled = False
scp.actor.property.diffuse = 0.0
scp.actor.property.ambient = 1.0
scp.actor.property.opacity = 1.0
scp.module_manager.scalar_lut_manager.data_range = [0, 1]
Thus, you can see your data on each cell and not as points (compare to the first figure showing the use of the !ScalarCutPlane module):
WarpScalar filter
You can use the !WarpScalar filter to warp a 2D surface for example. See [:Cookbook/MayaVi/Examples: Example using mlab (surf_regular_mlab.py)].
TransformData filter
Section author: FredericPetit
Attachments