Matplotlib: shaded regions
| Date: | 2007-12-06 (last modified), 2007-12-06 (created) |
|---|
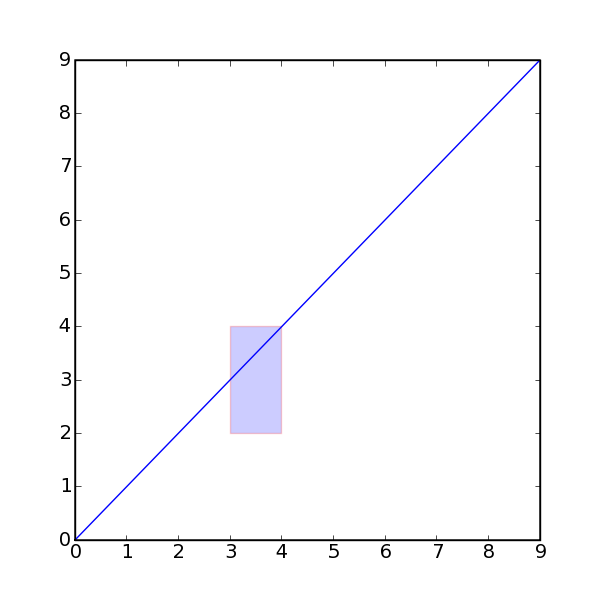
Use the fill function to make shaded regions of any color tint. Here is an example.
In [1]:
from pylab import *

x = arange(10)
y = x

# Plot junk and then a filled region
plot(x, y)

# Make a blue box that is somewhat see-through
# and has a red border.
# WARNING: alpha doesn't work in postscript output....
fill([3,4,4,3], [2,2,4,4], 'b', alpha=0.2, edgecolor='r')
Out[1]:

Section author: jesrl
Attachments